Plugins in Dynamics 365 : Part 7
Hello Guys,
In my previous blogs we have seen how to implement Pre Image and Post Image. Today we will see how we can debug Plugin. But before if you are new to our blog then do follow us to know more about Dynamics and Power Platform. Also if you like our blog then please comment and share this blog with your friends.
In our blog Plugins in Dynamics 365: Part 5 we have implemented Plugin trace log for tracing the logs if our plugin stop working. We can debug the plugin to resolve any error which are thrown by plugins. Follow below steps for implementing Plugin Debugging.
Step 1:- Open Plugin Registration Tool and Login to your organization.
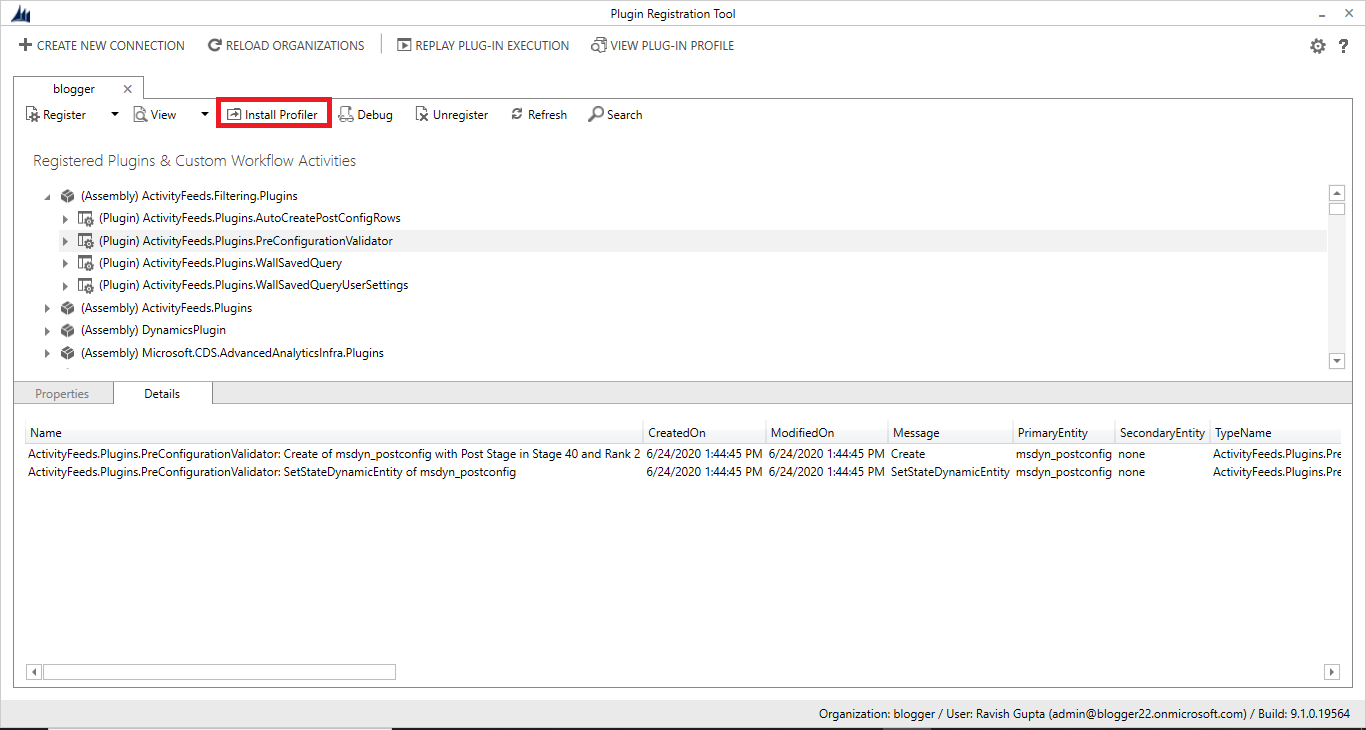
Step 2:- Click on install Profiler button.
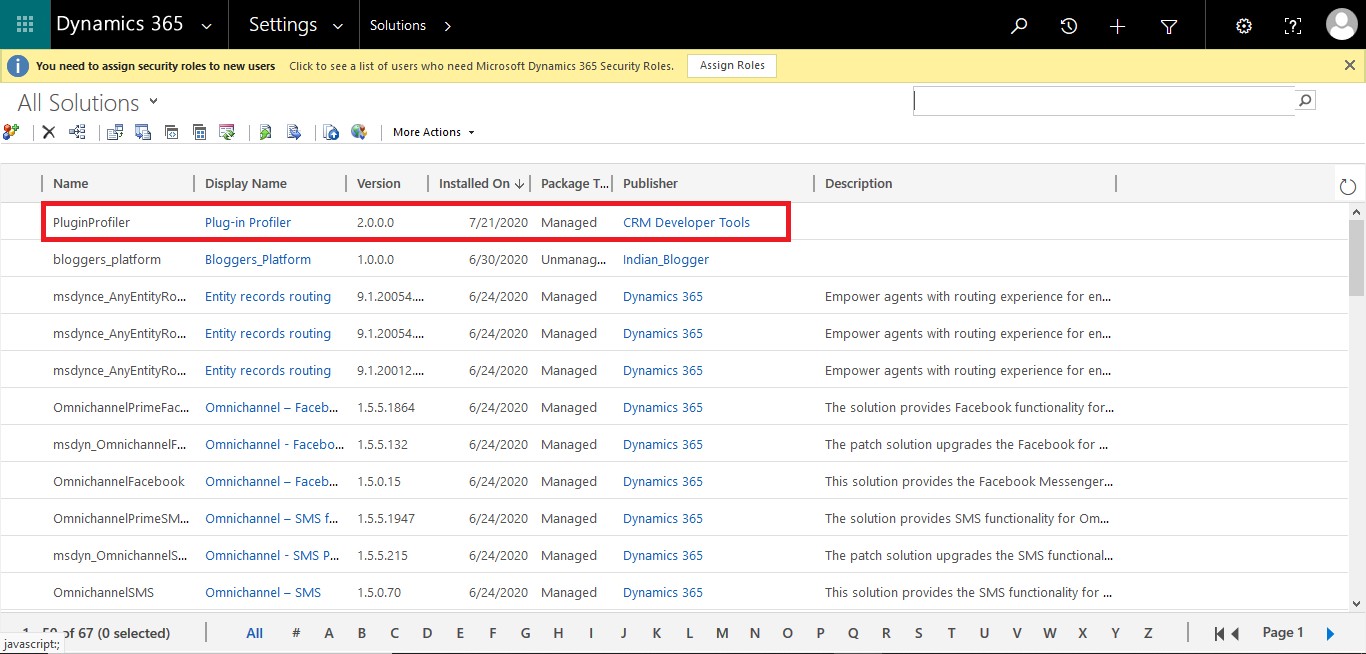
Step 3:- Once it is installed it will look like this. Also in CRM Plugin-Profiler solution will be installed.
Step 4:- Now select the step which you want to debug and click on Start Profiling in menu.
Step 5:- You will see one window. Select Exception and click on OK.
Once you will click on Ok, step will be updated as below:
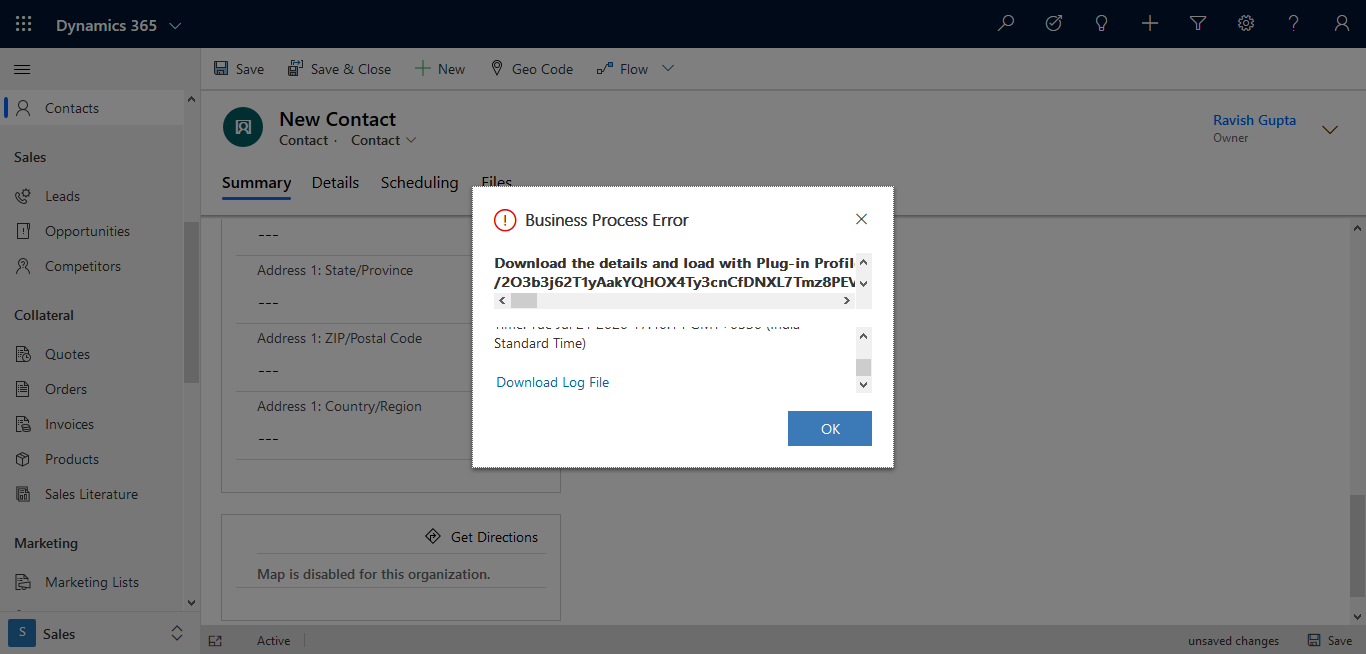
Step 6:- Now you need to perform the operation on which you have started the profiling. It will generate an error and a log file. Save this log file.
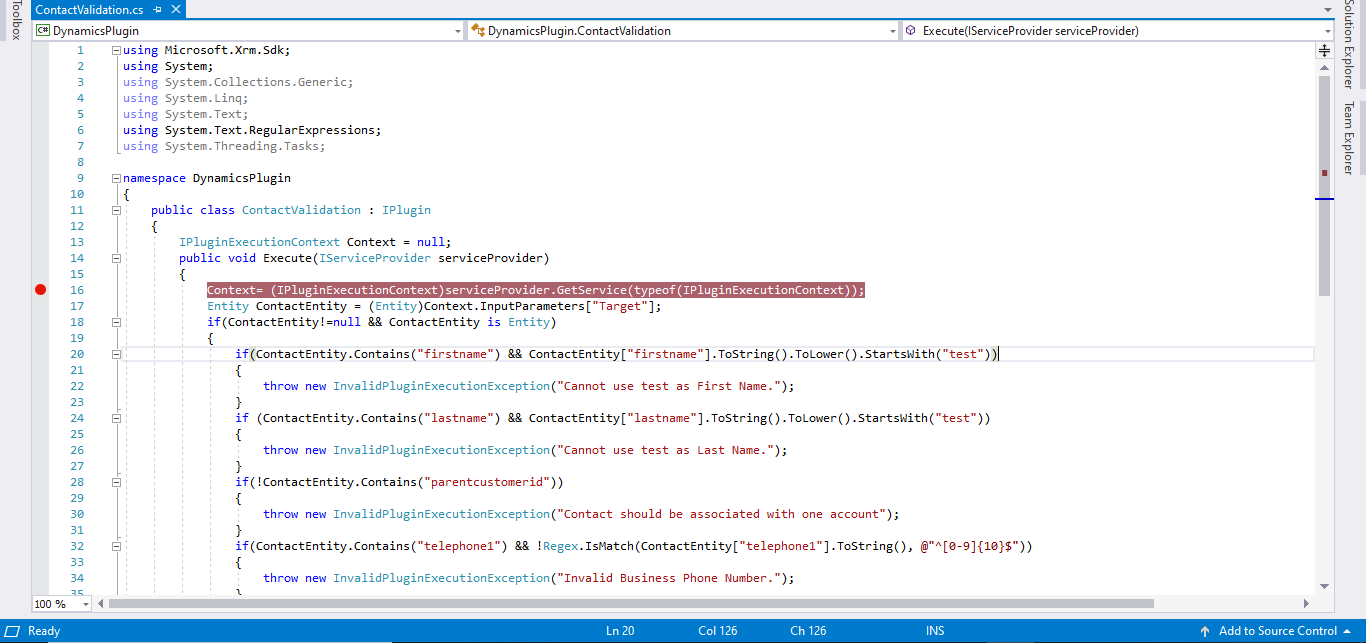
Step 7:- Now open Plugin Solution in Visual Studio and put the break point in the execute method of the plugin which you have executed.
Step 8:- From the menu click on Debug -> Attach to Process. -> Select Plugin Registration -> Attach.
Step 9:- Now in Plugin Registration Tool, Click on Debug. You will see a window. Specify error Log file in Profile, Specify dll which you want debug and select the step and click on Start Execution.
Once you will click on Start Execution, the debugger stops at the break point where you inserted in code.
So now you can start debugging.
Hope it helps...


👍
ReplyDeleteAwesome blog .. thanks👌
ReplyDeleteThanks Sumit
Delete